
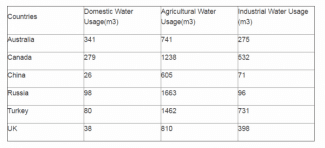
The table depicts percentage the of water usage in six different nations (Canada, United Kingdom, China, Australia, India, and Japan) in 2003 for three different purposes domestic, industrial, and agricultural.
In general, it is more than clear agriculture
use
has high figures from other categories Use synonyms
use
. Use synonyms
On the other hand
, industrial purposes are less than a per cent, Linking Words
moreover
, Australia takes the lowest number in the table.
Linking Words
Therefore
, the only United Kingdom overtaken 80% in agricultural Linking Words
use
, Use synonyms
in addition
, has the same percentage in domestic and industrial around 5%. Linking Words
Whereas
Canada and Australia’s water Linking Words
use
in domestic approximate percentage, different between them minus two figures.
Use synonyms
Finally
, water usage for agricultural purposes reached its peak, Linking Words
then
industrial come in second Linking Words
center
, Change the spelling
centre
then
domestic took Linking Words
last
in order for ratio.Linking Words