
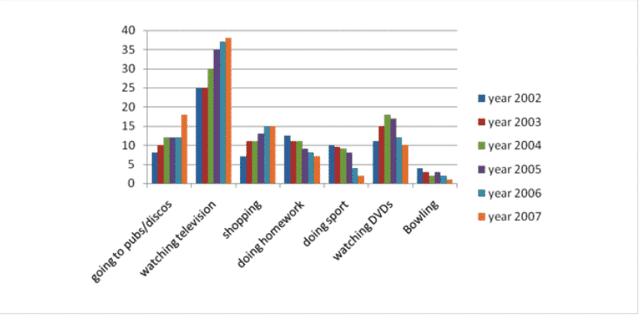
The bar chart explains how much
time
Use synonyms
teenagers
spent doing some activities in Chester between 2002 and 2007. The unit is calibrated in hours per Use synonyms
week
. Use synonyms
Overall
, Linking Words
teenagers
spend most of their Use synonyms
time
watching television and use the least Use synonyms
time
bowling.
It can be seen from the chart that three kinds of activities, namely going to public pubs, watching television and shopping, were shown an increasing trend during the given period and reached a peak in those 2007 data, especially for the number of hours per Use synonyms
week
Use synonyms
teenagers
used to watch television which reached more than 35 hours per Use synonyms
week
.
Meanwhile, other types of leisure Use synonyms
teenagers
did, including Use synonyms
doing
homework, Unnecessary verb
apply
doing
sports, and bowling, showed a decreasing pattern, especially in 2007 when most Unnecessary verb
apply
teenagers
only did bowling for around an hour per Use synonyms
week
. Use synonyms
In addition
, in terms of watching DVDs, it can be inferred from the chart that the trend of the total Linking Words
time
in watching DVDs was oscillating.Use synonyms