
The bar
char
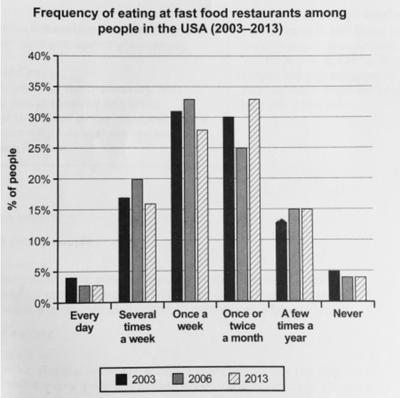
illustrate how regularly of Correct your spelling
chart
USA
citizen Use synonyms
eating
at fast Wrong verb form
ate
food
Use synonyms
restaurant
among Use synonyms
people
Use synonyms
in
2003 until 2013. The Information Change preposition
from
divided
into six categories that the Add a missing verb
is divided
respondens
should be chosen, Correct your spelling
respondents
respondent
such
as every day, several times a Linking Words
week
, once a Use synonyms
week
, once or twice a month, a few times a year, and never. The Use synonyms
value
of the bar chart is Use synonyms
delivering
using Wrong verb form
delivered
percentage
of Add an article
a percentage
the percentage
people
. The comparison of Use synonyms
this
chart focus on three Linking Words
period
of the year. It Change to a plural noun
periods
consist
of 2003, 2006 and 2013.
Change the verb form
consists
Overall
, the majority Linking Words
people
of Use synonyms
USA
Use synonyms
eating
at fast Wrong verb form
ate
food
Use synonyms
Use synonyms
restaurant
once a Fix the agreement mistake
restaurants
week
Use synonyms
on
2003 and 2006 and once or twice a month Change preposition
in
on
2013. The intensively Change preposition
in
is
increase over the years. Unnecessary verb
apply
However
, the Linking Words
category
of ‘Never’ has Use synonyms
decrease
that proving Change the verb form
decreased
of
Change preposition
apply
USA
Use synonyms
people
Use synonyms
willing
to eat at fast Add a missing verb
are willing
food
Use synonyms
Use synonyms
restaurant
.
The percentage of Fix the agreement mistake
restaurants
people
eating fast Use synonyms
food
“every day” at Use synonyms
Use synonyms
Add an article
the restaurant
a restaurant
restaurant
is decreasing Fix the agreement mistake
restaurants
of
the year Change preposition
in
start
from 4% to 3%. It is Wrong verb form
starting
a good news
that Remove the article
good news
a piece of good news
Use synonyms
USA
Correct your spelling
US
people
Use synonyms
aware
to change Add a missing verb
are aware
bad
Add an article
a bad
habit
. Fix the agreement mistake
habits
Beside
that things, Replace the word
Besides
on
Change preposition
in
Use synonyms
category
“several times a Add an article
the category
week
” the Use synonyms
value
Use synonyms
have
fluctuation Change the verb form
has
on
the third period that Change preposition
in
the
higher is on 2006 Correct article usage
apply
is
about 20% and the lower is on 2013 Unnecessary verb
apply
is
about 16. For the “once a Correct word choice
and is
week
” Use synonyms
category
shown the dynamic Use synonyms
value
of the percentage with the biggest score Use synonyms
on
2006 is 33%. The unique phenomenon Change preposition
in
on
the Change preposition
of
illustrate
is in the Replace the word
illustration
category
of “once or twice a month” that Use synonyms
the
Correct article usage
apply
point
out in 2013 with Replace the word
pointed
the
Correct article usage
a
value
of 33%.
All in all, the trend data is quite normal and the habit of eating well is exist Use synonyms
on
Change preposition
in
USA
Use synonyms
people
because they are regularly eating fast Use synonyms
food
just once a Use synonyms
week
(Use synonyms
approximatelly
25% of the respondent) and the other one who is keeping eat well ( health Correct your spelling
approximately
food
) that never try fast Use synonyms
food
is approximately on 4%. Eating fast Use synonyms
food
is a bad habit for our health, but you still eat Use synonyms
on
Change preposition
at
normal
size Add an article
the normal
on
your body.Change preposition
in