
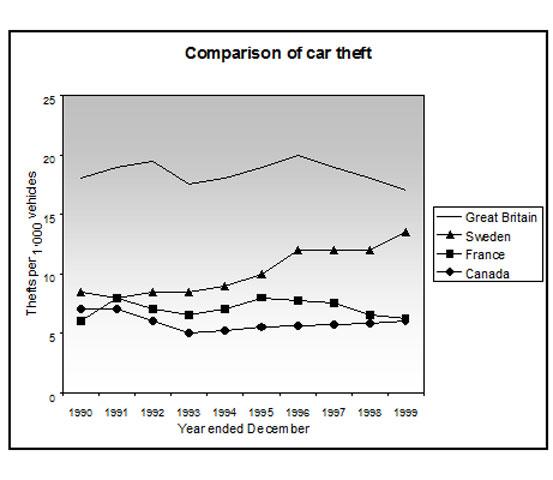
The line graph describes vehicle
theft
Use synonyms
rates
measured in thousands in four different countries namely Britain, Use synonyms
Sweden
, Use synonyms
France
and Canada from 1990 to 1999.
Use synonyms
Overall
, most of the transport Linking Words
are
stolen in Great Britain throughout the years. Change the verb form
is
However
, Linking Words
France
and Use synonyms
Sweden
had fluctuations over the periods. Use synonyms
Conversely
, Linking Words
Sweden
shows an upward trend.
With regards to Use synonyms
the
Britain, at the start of the period, there Correct article usage
apply
was
nearly 17000 Correct subject-verb agreement
were
vechiles
Correct your spelling
vehicles
thefts
attempts are made. Later on, the Change the noun form
theft
theft
Use synonyms
rates
increased steadily for three years and it attained its peak in 1993
After that, it faced a sudden decline around16000 by 1994. Use synonyms
Likewise
, the Linking Words
rates
are starts to increase and Use synonyms
peak
at 20000 in 1997. At Wrong verb form
peaked
last
, Linking Words
at the end
of the period Linking Words
although
it starts to decline it finished with a higher percentage of Linking Words
theft
Use synonyms
rates
. Use synonyms
Similarly
, Linking Words
Sweden
shows a gradual rise from the beginning of the year 1990 which is around 7000. It continues to increase till 1996 and after that, it remained in a steady state for Use synonyms
further
two years Linking Words
as
13000. Change preposition
at
Finally
, it ends at 14000 in the year Linking Words
of
1999.
Change preposition
apply
On the other hand
, Canada and Linking Words
France
were the countries with Use synonyms
low
proportion of stolen vehicles.
In 1990, 6000 Add an article
a low
theft
incidents are noted in 1990 Canada. Use synonyms
Similarly
, Linking Words
Use synonyms
France
rate was 1 thousand lower in that same period. Both countries faced various trends. But, in the end, Both showed the same amount of 6000.Change noun form
France's