
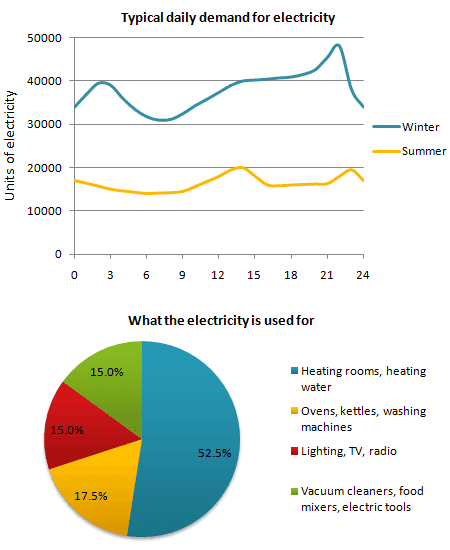
The line graph outlines the typical daily demand for
electricity
in Use synonyms
winter
and summer. All trends exhibit positive growth, albeit at different rates. Meanwhile, the lion’s Use synonyms
share
of the pie chart was allotted to the Use synonyms
electricity
consumption for the heating room and water in Use synonyms
winter
, which contradicts Use synonyms
modest
proportions of household appliances.
The Correct article usage
the modest
electricity
consumption in Use synonyms
winter
jumped back and forth to a shade of 5000 Use synonyms
units
continuously and Use synonyms
finally
stayed at 40000 Linking Words
units
over the first 15 Use synonyms
hours
. After a slight lull lasted for 6 Use synonyms
hours
Use synonyms
afterward
, it notably accelerated a shade of 7000 Change the spelling
afterwards
units
and reached the highest point before falling back to starting point for the rest of the day. Use synonyms
Electricity
provision in summer remained stable at a shy of 15000 Use synonyms
units
from 0 to 21 Use synonyms
hours
, Use synonyms
although
there was a remarkable acceleration from 15000 Linking Words
units
to 20000 Use synonyms
units
between 13 Use synonyms
hours
to 14 Use synonyms
hours
becoming the lion’s Use synonyms
share
of that in summer. The positive correlation with the predominance rose a shy of 20000 Use synonyms
units
from 21 until the end of the day.
Regarding the partitioned pie chart, the heating rooms and heating water accounted for the lion’s Use synonyms
share
of the Use synonyms
electricity
consumption in Use synonyms
winter
(52.5%). Lighting, TV, radio, and vacuum cleaners, food mixers, electric tools remained a positive correlation (15%). The Use synonyms
share
of remainders contributed 17% of the pie chart.Use synonyms