
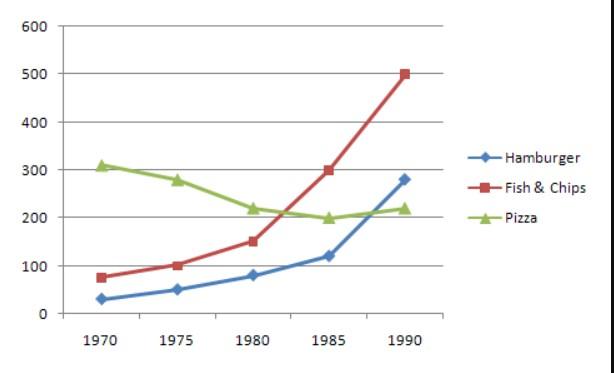
The line graph shows the
consumption
of fast food in the UK from 1970 to 1990 and it was divided into three parts.
Use synonyms
Overall
, it was clear that the public was more likely to spend their money on Linking Words
hamburger
and Fix the agreement mistake
hamburgers
fish
& Use synonyms
chips
as time go by. On the counterpart, citizens did not like eating pizza as they used to .
Use synonyms
Fish
& Use synonyms
chips
and hamburgers all had a rising trend, but the Use synonyms
consumption
of Use synonyms
Fish
& Use synonyms
chips
was soar from 1980 to 1990(150~500). Use synonyms
Besides
, the expenditure on hamburgers Linking Words
also
has a gradual increase which was 90 in 1980 to 290 in 1990. The Linking Words
consumption
of pizza is the largest part at the beginning, which was 300 in 1970. Use synonyms
However
, it dramatically decreased until 1985 reached the lowest point(200), Linking Words
then
it had a slight increase between 1985 and 1990. In the end, Linking Words
Fish
& Use synonyms
chips
owned the largest Use synonyms
consumption
in 1990, which was 500. The second large part was hamburgers (about 300).Use synonyms