
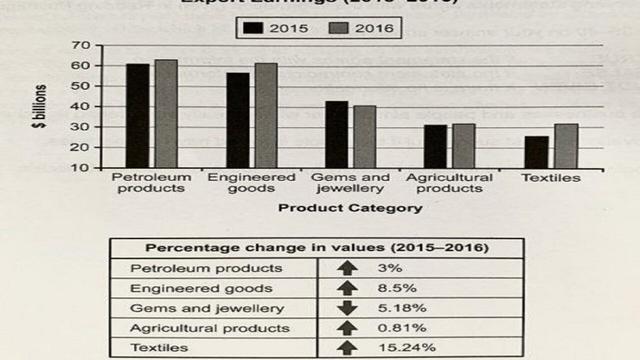
The bar chart and table illustrate how much a state earned for selling 5 different
products
to other countries in 2015 and 2016 and changes in these sales in proportion. Units are measured in billion of dollars.
Looking from an Use synonyms
overall
perspective, it is readily apparent that petroleum Linking Words
products
were the most money provider among these five, Use synonyms
whereas
Linking Words
textiles
were the least. , Use synonyms
Moreover
, the widest disparity between 2015 and 2016 gains belongs to Linking Words
textiles
.
In the first diagram, it is observed that petroleum Use synonyms
products
and engineered goods were paid for most by foreign countries in 2015 ( approximately 60 and 55 respectively) and Use synonyms
also
in 2016 (just over 60 for both). These figures were followed by gems/jewellery and agricultural Linking Words
products
in both two years which were roughly 40 and 30 respectively. Use synonyms
Textiles
were the least source of income in 2015 and the income was around 25 billion dollars and Use synonyms
also
in 2016. (slightly over 30)
Linking Words
According to
the second picture, Linking Words
textiles
saw the most significant difference between gains in two years which was 15.24%. In comparison, the money made from agricultural Use synonyms
products
remained almost steady and the change was only 0.81%. Engineered goods represented the second widest disparity with 8.5%, followed by gems/jewellery (5.18%) and petroleum goods.(3%)Use synonyms