
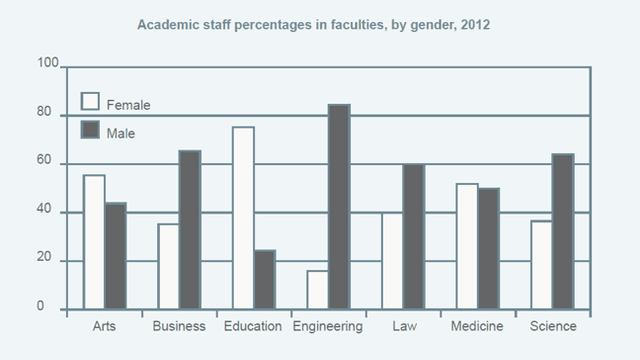
The bar chart illustrates the proportion of male and female
staff
who work in a major university by different sectors in 2012. Use synonyms
Overall
, Linking Words
while
there are more female Linking Words
staff
specialized in education, it is interesting that engineering is the most common field among male professors.
Use synonyms
According to
the graph, education and arts are dominated by female Linking Words
staff
. Use synonyms
For example
, the number of female Linking Words
staff
teaching education is much higher than that of male Use synonyms
staff
with 72% and 25 respectively. Female teachers are more common in arts Use synonyms
although
the gap between the number of females and males is smaller.
Linking Words
In contrast
, it seems that male-dominated fields of teaching include business, engineering, law and science. In fact, they are outnumbered by 20-30% in the fields of business, law and science. Linking Words
However
, the most dramatic difference occurred in engineering whose percentage of male Linking Words
staff
is 85% Use synonyms
whereas
that of female Linking Words
staff
only accounts for 18%.Use synonyms