
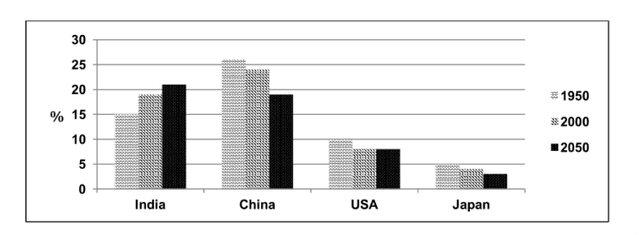
The following bar chart illustrates the rates of the total world
population
in four different countries in 1950 and 2002 and the expectation for 2050.
Use synonyms
Overall
, it can be clearly seen that in 1950, China was the most populated country in comparison with the other countries, Linking Words
while
Japan was the least populated country. Linking Words
However
, the USA had the same percentage in 2002 and 2050. Linking Words
Moreover
, the Linking Words
population
of India has been increasing since 1950.
Use synonyms
On the other hand
, Between 2002 and 2050 there is a significant growth in China’s Linking Words
population
as it went from 15 Use synonyms
Use synonyms
percent
to 20 Change the spelling
per cent
Use synonyms
percent
. Meanwhile, the percentage of Japan has been falling through the given, period as it hit approximately 2 Change the spelling
per cent
Use synonyms
percent
in 2050. Change the spelling
per cent
Furthermore
, in the USA the Linking Words
population
fell in 1950 but in the next few Use synonyms
years
it remained stable. India had its lowest rate in 1950 which is 15 Add a comma
,years
Use synonyms
percent
.Change the spelling
per cent