
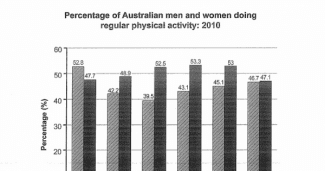
The bar chart illustrates the proportion of different ages of
men
and Use synonyms
women
who do typical exercise in Australia in the year 2010.
Use synonyms
Overall
, in every range of age, the percentage of Linking Words
women
who did regular exercise is higher than Use synonyms
men
except for those who were 15 to 24 years old.
Looking into the details, it could be seen that people in 35 to 44 has the biggest difference between the number of male and female which of around 12% followed by roughly 10% of those who 45 to 54 year of age and Use synonyms
lastly
approximately 8% of those who is 55 to 64 years old.
Linking Words
On the other hand
, people who were above 65 were more likely to exercise regularly both Linking Words
men
and Use synonyms
women
, they have almost the same proportion, the percentage of Use synonyms
women
was 47.1% Use synonyms
while
Linking Words
men
are 46.7%. Use synonyms
Moreover
, teenagers between 15 to 24 years of age especiallyLinking Words
female
occupied the greatest percentage which was 52.8% meanwhile in males was 52.8%.Fix the agreement mistake
females