
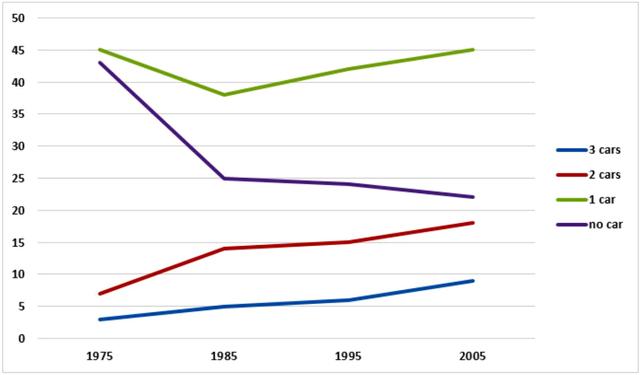
This
line chart illustrates the percentage of Linking Words
car
Use synonyms
owners
in the UK from 1975 to 2005. Generally speaking, in the UK, the Use synonyms
number
of residents who owned Use synonyms
cars
was greater than that of those who didn’t have Use synonyms
cars
.
As can be seen, Use synonyms
people
mostly owned only Use synonyms
one
Use synonyms
car
in the UK. It can Use synonyms
also
be seen that the Linking Words
number
of Use synonyms
people
who owned Use synonyms
two
or Use synonyms
three
Use synonyms
cars
was lower than the Use synonyms
number
of Use synonyms
people
who owned Use synonyms
one
Use synonyms
car
, but Use synonyms
owners
of Use synonyms
two
or Use synonyms
three
Use synonyms
cars
kept increasing from 1975 to 2005. Use synonyms
Additionally
, the percentage of Linking Words
owners
who had no Use synonyms
car
kept decreasing.
From 1975 to 1985, those who owned Use synonyms
one
Use synonyms
car
and those who had no Use synonyms
car
decreased significantly, meanwhiles the Use synonyms
number
of Use synonyms
owners
of Use synonyms
two
or Use synonyms
three
Use synonyms
cars
slightly increased. Use synonyms
Besides
, expect the no Linking Words
car
ownership, the percentages of other Use synonyms
car
Use synonyms
owners
in the rest of the twenty years were all growing.
since 1985, the Use synonyms
number
of Use synonyms
people
who didn’t have a Use synonyms
car
nearly changed their actions, the percentage almost remained at the same level. In 2005, Use synonyms
one
Use synonyms
car
owner (45) was just five as greater than Use synonyms
three
Use synonyms
cars
owner (9), yet Use synonyms
two
Use synonyms
car
Use synonyms
owners
(18) were approximately twice larger than Use synonyms
three
Use synonyms
car
Use synonyms
owners
(9). Use synonyms
In addition
, those who owned Linking Words
two
Use synonyms
cars
were slightly smaller than no Use synonyms
car
Use synonyms
owners
.Use synonyms