
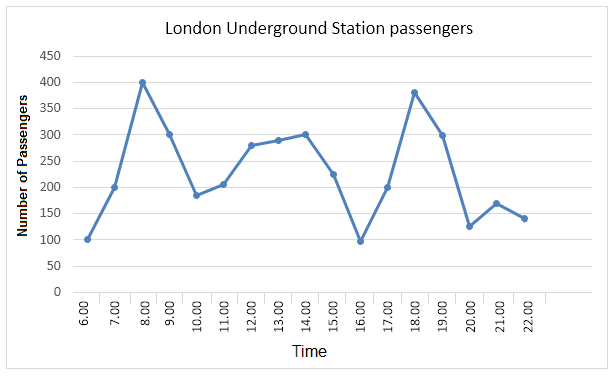
This
line graph depicts Underground Linking Words
Station
passenger numbers in London on one day at different times. The time range of the figure is from 6:00 am to 10:00 Use synonyms
pm
.
Use synonyms
Overall
, 8am and 6pm are Linking Words
passengers
peak hours, there are 400 Use synonyms
passengers
in London underground Use synonyms
station
at 8am, and ~380 Use synonyms
passengers
at 6 Use synonyms
pm
. Use synonyms
In contrast
, the least frequented times at London underground Linking Words
station
are 6 am and 4 Use synonyms
pm
, there are only 100 Use synonyms
passengers
in the Use synonyms
station
.
Looking at the trend of the figure. There is a period of rapid growth and Use synonyms
then
a decline in the number of Linking Words
passengers
respectively in the morning and afternoon. The number of Use synonyms
passengers
rapidly grew from 6 am to 8 Use synonyms
pm
and Use synonyms
then
reduce from 8 am to 10 am. Linking Words
While
in the afternoon, the number of Linking Words
passengers
grew from 4 Use synonyms
pm
to 6 Use synonyms
pm
and Use synonyms
then
declined from 6pm to 8pm.Linking Words