You should spend about 20 minutes on this task. The graph shows Underground Station passenger numbers in London. Summarise the information by selecting and reporting the main features, and make comparisons where relevant. You should write at least 150 words.

You should spend about 20 minutes on this task.

The graph shows Underground Station passenger numbers in London.

Summarise the information by selecting and reporting the main features, and make comparisons where relevant.

You should write at least 150 words.
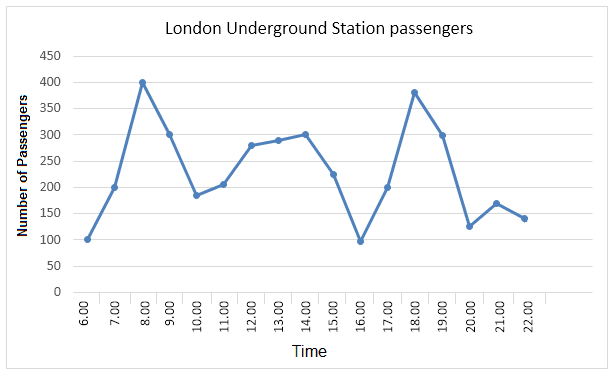
The line chart shows London Underground Station passenger numbers from 6:00 am to 10:00 pm.
Overall
, eight in the morning and six in the afternoon are the peak of passenger flow in London Underground Station.
In contrast
, 6:00 am and 4:00 pm are the least crowded. Looking at the figures in morning. There are 100 passengers in London Underground Station at 6:00 am. The number grew to 200 at 7am and reached a morning peak to 400 at 8am. After 8am, the number of passengers started to drop and by 10am, the number of passengers dropped to under 200.
Submitted by shjwudp on

Unauthorized use and/or duplication of this material without express and written permission from this site’s author and/or owner is strictly prohibited. Excerpts and links may be used, provided that full and clear credit is given to Writing9 with appropriate and specific direction to the original content.

Sentences: Add more complex sentences.
Common mistake: Your writing should be 150-250 words.
Vocabulary: Rephrase the word "shows" in your introduction.
Vocabulary: Only 6 basic words for charts were used.
Vocabulary: The word "number of" was used 2 times.
Vocabulary: Use several vocabularies to present the data in the second paragraph.
What to do next:
Look at other essays: