
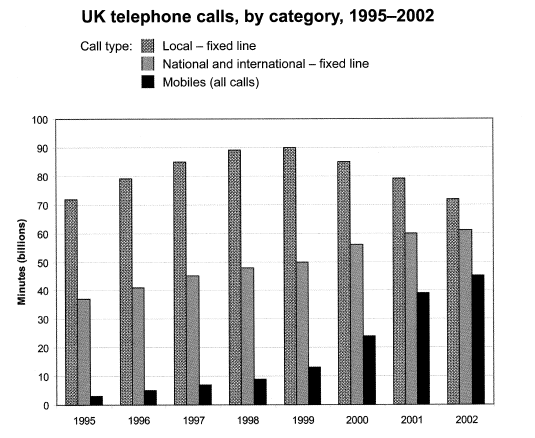
The chart provides data about the total times that are used by individuals in the Uk via telephone in billions and split into three categories in the duration 1995-2022.
Overall
, All Uk calls faced an upward and downward trend throughout a given stage of time.All three calls were in billions and they had a huge proportion.
The local fixed line had the same proportion that was a little under 70% in the starting year 1995 as well it had the same value in the Linking Words
last
stage of calls.Linking Words
However
, the Local fixed line faced growth gradually and it had an equal proportion which was around about 90% in both given periods of the year. After that, local lines started to decrease consistently.
In National and international- fixed lines faced growth moderately. The call was nearly 40% in the year 1995, which was starting period of calls. Linking Words
In addition
, it reaches just under 60% in both periods of time .
There was a huge rise in mobile calls in the period 1995 and it rose dramatically to around 40% by the end period of time in 2002.Linking Words
Moreover
, Mobile calls were the least used call in all periods of the season.Linking Words