
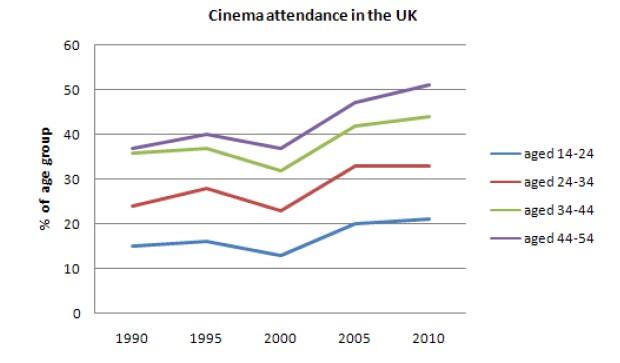
The given line chart shows the percentage of people by
age
group who went to the cinema from 1990 to 2010.
Use synonyms
Overall
, we can see that all four categories followed the same pattern during the 20-year period. Linking Words
However
, the 44-54 Linking Words
age
group had the biggest number of cinema attendance.
In 1990, the biggest percentage of movie users accounted for those 34-54 years old at 37%, Use synonyms
whereas
the lowest figure involved the youth between the Linking Words
age
of 14 and 24 at about 15% and just above 20% for those under 34. All the numbers increased gradually until 1995 before dropping slowly by 2000.
In the next five years, the UK cinema witnessed a significant growth of users' attendance by nearly 10% for each Use synonyms
age
group. By 2010, these figures had reached their peaks, with the highest percentage at just over 50 including the oldest visitors and around 20% for the younger generations.Use synonyms