
The
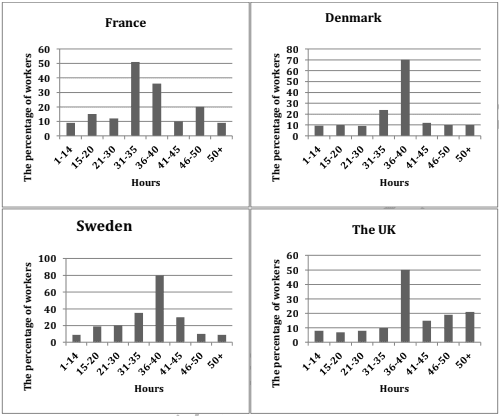
four bar
chats compare how much time people worked per week in Denmark, Norway, Sweden, and Finland in 2002. It is obvious that 35–40-year-old Add a hyphen
four-bar
groups
were the major workers in those countries, Use synonyms
while
all 1-14 age Linking Words
groups
certainly seldom worked in 2002.
Use synonyms
To begin
with, it can be seen that the highest Linking Words
work
hours weekly Use synonyms
groups
were 35-40 years old, particularly in Norway 35–40 age citizens spend Use synonyms
most
time on Add an article
the most
work
weekly at 48.1%. Use synonyms
In contrast
, 1-14 age Linking Words
groups
were the lowest Use synonyms
groups
to Use synonyms
work
per week in 4 countries, and these ages were the smallest workers at merely 3.2% in Sweden.
We can see that the percentage of Use synonyms
work
hours weekly in Sweden and in Norway had similar patterns in 2002, in which the second-highest Use synonyms
groups
were both above 41 ages, around 17% Use synonyms
workers
, and the third populations were 21-30 ages. Change preposition
of workers
Additionally
, the above 41-year-old worker group was the lowest at only 9.6% in Denmark.Linking Words