
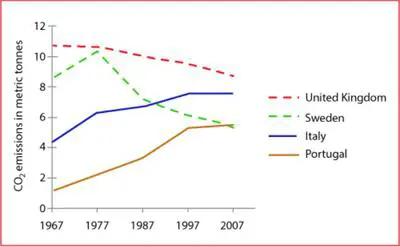
The line chart illustrates the average amount of
carbon
Use synonyms
dioxide
released by a person ( in metric Use synonyms
tonnes
) in 4 different European countries over Use synonyms
the
40-year period of Correct article usage
a
time
. The X-axis show ter during the given Use synonyms
time
range Use synonyms
which
was closer to 11 metric Correct pronoun usage
it
tonnes
Use synonyms
while
Portugal was the least contributor which was about 1 metric tonne in 1967. In 2007, both Sweden and Portugal emitted an equal amount of Linking Words
Carbon
Use synonyms
dioxide
which was around 5.5 metric Use synonyms
tonnes
. s the Use synonyms
time
period from 1967 to 2007 Use synonyms
while
the Y-axis gives data on the quantity of Linking Words
carbon
Use synonyms
dioxide
emitted.
In the United Kingdom, the CO2 emission decreased gradually over the Use synonyms
time
period Use synonyms
whereas
in Portugal and Italy, significant growth can be observed up until the year 1997 and after that emissions remained almost at the same level
in the following 10 years.
In Sweden, Linking Words
Carbon
Use synonyms
dioxide
release showed an upward trend from 1967 to 1977 when it peaked, Use synonyms
then
it declined continuously over the next 30 years. ,Linking Words
However
out of all 4 countries, the UK was the largest CO2 emitter during the given Linking Words
time
range which was closer to 11 metric Use synonyms
tonnes
Use synonyms
while
Portugal was the least contributor which was about 1 metric tonne in 1967. In 2007, both Sweden and Portugal emitted an equal amount of Linking Words
Carbon
Use synonyms
dioxide
which was around 5.5 metric Use synonyms
tonnes
.Use synonyms