
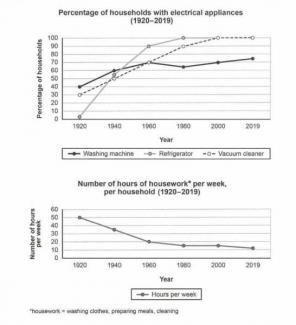
The provided line graphs demonstrate the fluctuations in the usage of electrical gadgets and the time expenditure doing
household
activities in a country in a life span of 99 years between 1920 till 2029.
The figures below are given in percentages on one line graph and in numbers on the other.
Use synonyms
Overall
, after looking at both charts, it can be found that the usage of washing Linking Words
machines
, refrigerators, and vacuum cleaners is the least in 1920. Use synonyms
While
there is a gradual brief rise in all three Linking Words
appliances
starting from 1980 to 2019. Use synonyms
Furthermore
, it can Linking Words
also
be added that in the below diagram, the Linking Words
household
members spent an enormous amount of Use synonyms
hours
doing activities Use synonyms
such
as washing clothes, preparing meals, and cleaning in 1920, but in 2019 Linking Words
this
is manifested with a huge reduction in figures Linking Words
due to
the escalation of ownership of Linking Words
household
Use synonyms
appliances
.
Use synonyms
To begin
with, housewives in 1920 didn’t own any electrical Linking Words
machines
for washing clothes or preparing meals and Use synonyms
that is
shown vividly in the first graph as the percentages for the usage of washing Linking Words
machines
, refrigerators, and vacuum cleaners are 40 Use synonyms
Use synonyms
percent
, 0 Change the spelling
per cent
Use synonyms
percent
and 30 Change the spelling
per cent
Use synonyms
percent
respectively. Whilst, a gradual increase was manifested in the years from 1980 to 2019 in the three gadgets with a Change the spelling
per cent
Use synonyms
percent
of 100 Replace the word
percentage
Use synonyms
percent
for two Change the spelling
per cent
appliances
and approximately around 75% for washing clothes Use synonyms
machines
Use synonyms
in particular
.
Linking Words
In addition
to that, the figures in the second chart show the simultaneous incline and decline in activities done at home in the same life span between 1920 till 2019. To illustrate, the Linking Words
household
members spent most of their time around 50 Use synonyms
hours
per week in 1920 doing every single home activity with their hands Use synonyms
due to
the non-ownership of Linking Words
appliances
. Use synonyms
While
a reflection of decline was manifested below in 1960 at 20 Linking Words
hours
per week and continues to decrease to 10 Use synonyms
hours
per week until we Use synonyms
reach2019
.Correct your spelling
reach 2019