
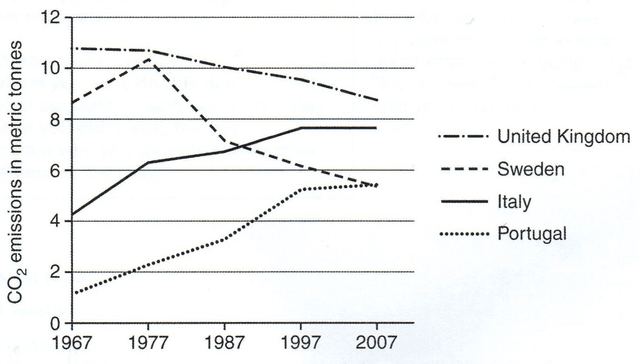
The line graph compares the per capita
carbon
Use synonyms
dioxide
Use synonyms
emissions
released in four different countries during four decades.
Use synonyms
Overall
, it is apparent that the average amount of Linking Words
carbon
Use synonyms
dioxide
Use synonyms
emissions
per person in Britain continuously dominated among the four nations, Use synonyms
while
the equivalent figure for Portugal ranked the lowest over the period shown. Linking Words
Besides
, the number of Linking Words
emissions
in Sweden and Italy saw a clear upward trend, compared with that of the other two countries.
In 1967, Portuguese people released the fewest amount of Use synonyms
carbon
Use synonyms
dioxide
, with a figure of about 1 metric tonne. In the following 40 years, the quantity of Use synonyms
carbon
Use synonyms
dioxide
Use synonyms
emissions
increased remarkably, peaking at approximately 5 metric Use synonyms
tonnes
in 2007. Use synonyms
Similarly
, an obvious increment can Linking Words
also
be seen in the amount of Linking Words
this
type of greenhouse gas Linking Words
emissions
in Italy, almost doubling from 4 in 1967 to roughly 8 metric Use synonyms
tonnes
in 2007.
Use synonyms
By contrast
, there was a downward trend in the UK, as the number of Linking Words
emissions
declined from about 11 to less than 9 metric Use synonyms
tonnes
throughout Use synonyms
this
period of time. Interestingly, in spite of the fluctuation of around 3 metric Linking Words
tonnes
between 1967 and 1987, the figure for Use synonyms
carbon
Use synonyms
dioxide
Use synonyms
emissions
per person had decreased since Use synonyms
then
, falling to about 7 metric Linking Words
tonnes
in 2007.Use synonyms