
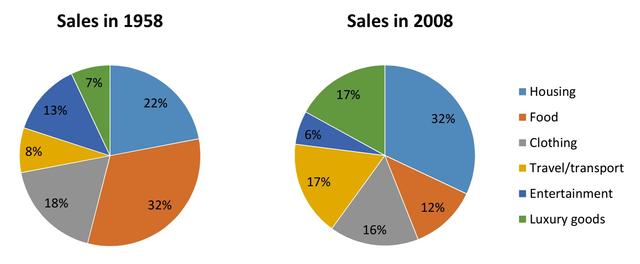
The two pie charts display the percentage of money spent on numerous commodities and services by one European country's citizens in two different years (1958 and 2008).
Overall
, it can be clearly observed that the most significant expenditures took place in the food sphere in the former stage and in the housing niche, which comprised 32 per Linking Words
cent
in the latter year.
The given information indicates the decline in the food sector, accounting for 32 per Use synonyms
cent
in 1958 and only 12 per Use synonyms
cent
by 2008. Use synonyms
In contrast
, the housing sphere witnesses an evident increase in people's expenditure, constituting 22 per Linking Words
cent
in the first presented year and 32 per Use synonyms
cent
in the Use synonyms
last
one.
Linking Words
Moreover
, with an obvious growth in percentage are seen luxury brands, receiving 7 per Linking Words
cent
in the first moment and approximately a triple in the following period. As for travelling, clothing and entertainment, there are unnoticeable changes, Use synonyms
although
the contrary is true for transport service, with a climb of 10 per Linking Words
cent
throughout the period. The contrary happens with entertainment, which loses a revenue of 7 per Use synonyms
cent
between 1958 and 2008.Use synonyms