The graphs show percentage of mobile phone owners using various mobile phone features. Summarise the information by selecting and reporting the main features, and make comparisons where relevant.

The graphs show percentage of mobile phone owners using various mobile phone features.

Summarise the information by selecting and reporting the main features, and make comparisons where relevant.
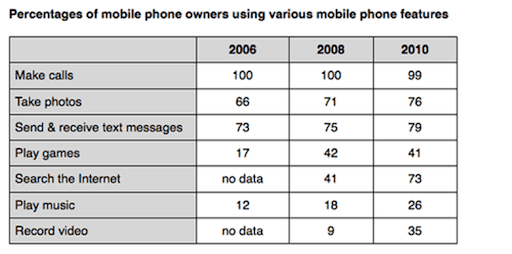
The table graph gives the proportion of cell phone owners using various cell phone features in 2006, 2008 and 2010.
Overall
, it can seem that three years graph compare seven features that make calls, take a photo, send&receive text message, play games, search the internet, play music and record video.
Submitted by itchayatop31 on

Unauthorized use and/or duplication of this material without express and written permission from this site’s author and/or owner is strictly prohibited. Excerpts and links may be used, provided that full and clear credit is given to Writing9 with appropriate and specific direction to the original content.

Sentences: Add more complex sentences.
Linking words: Add more linking words.
Basic structure: Write more paragraphs.
Basic structure: Add more body paragraphs.
Common mistake: Your writing should be 150-250 words.
Basic structure: Write more paragraphs.
Vocabulary: Only 5 basic words for charts were used.
Vocabulary: The word "graph" was used 2 times.
What to do next:
Look at other essays: