The bar chart below gives information about the percentage of the population living in urban areas in different parts of the world. Summarise the information by selecting and reporting the main features, and make comparisons where relevant.

The bar chart below gives information about the percentage of the population living in urban areas in different parts of the world.

Summarise the information by selecting and reporting the main features, and make comparisons where relevant.
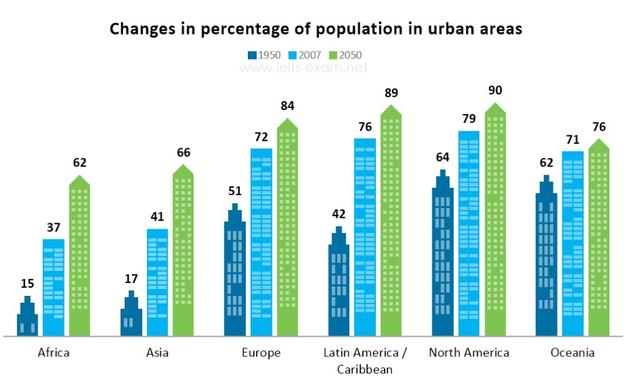
The given bar chart displays what percentage of
people
living either in Africa, Asia, Europe, Latin
America
/Caribbean, North
America
, or Oceania in 1950 and 2007 lived in urban areas of these continents. The chart
also
includes a forecast of the percentages that will live there in 2050.
Overall
, it can be seen that every continent fraction experienced and would be likely to experience an increase. The biggest rise took place in Latin
America
/ Caribbean,
whereas
the smallest one was in Oceania. Regarding the changes from 1950 and 200, Asia and Africa had really similar and low percentages, going from around 15 in 1950 to approximately 40 in 2007, more than doubling,
while
Europe
instead
experienced a similar percentage increase to theirs,
such
as an approximately 20% expand of urban
people
. The greatest growth, as previously mentioned, was in Latin
America
/Caribbean, almost doubling its fraction with a 34% increase. About the prevision, Africa is supposed to double its proportion of
people
living in the city and just followed by Asia's identical supposed growth of 25%. Meanwhile, the other continents would be likely to gain around 10% of
people
moving there
Submitted by marianiculescu1103 on

Unauthorized use and/or duplication of this material without express and written permission from this site’s author and/or owner is strictly prohibited. Excerpts and links may be used, provided that full and clear credit is given to Writing9 with appropriate and specific direction to the original content.

Introduction: The introduction is missing.
Introduction: The chart intro is missing.
Vocabulary: Replace the words people, america with synonyms.
Vocabulary: The word "chart" was used 2 times.
Vocabulary: The word "percentage" was used 4 times.
Vocabulary: The word "growth" was used 2 times.
Vocabulary: The word "increase" was used 3 times.
Vocabulary: The word "approximately" was used 2 times.
Vocabulary: The word "around" was used 2 times.
Topic Vocabulary:
  • urban areas
  • population density
  • economic development
  • historical urbanization
  • trends and outliers
  • urbanization levels
  • socio-economic implications
  • environmental impact
  • urban living
  • global trend
  • development strategies
What to do next:
Look at other essays: