
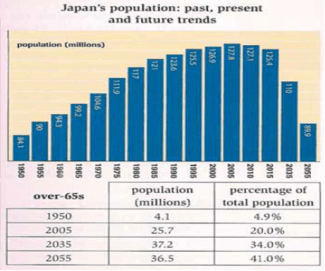
The table and chart provide data regarding populace growth and the proportion of the populace over 65 over a 100-year period in
Japan
.
Use synonyms
According to
the Linking Words
information
Add a comma
,information
Japan
's general population figures in 1950 were very different from those in 2005 and future predictions illustrate even greater differences. In 1950, the number of people was just over 84 million, and only 4.9 per cent of these individuals were above the age of 65. By 2005 the percentage of older individuals rose considerably to 20 per cent, Use synonyms
while
the Linking Words
overall
populace had shown a parallel increase to nearly 128 million.
Linking Words
However
, total community figures peaked in 2005, and it is excepted that the number of humans living in Linking Words
Japan
will decrease substantially over the next 50 years to a little below 90 million. In spite of Use synonyms
this
fall, the rise in the ageing community will continue, and at a faster rate, so that by 2055, 41 per cent of Japanese humans will be over 65.
Linking Words
Overall
, these statics show two contrasting trends in Linking Words
Japan
's demographics that will result in fewer citizens, but greater numbers of elderly peopleUse synonyms