
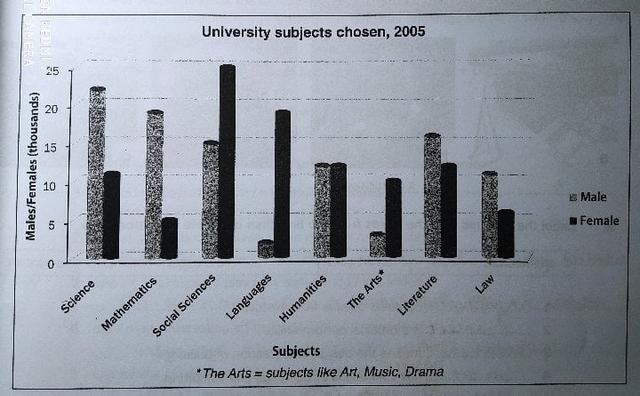
The bar charts presented information about the figures of students that were interested in different subjects called science, mathematics, social sciences,
languages
, humanities, arts, literature, and law in the year 2005.
Use synonyms
Overall
, the bar charts compared information about men and women. Linking Words
In addition
, the arts mean subjects Linking Words
for example
art, music and drama. The proportion of women who were interested in social sciences was the highest. Linking Words
In contrast
, the lowest percentage was males who studied Linking Words
languages
.
Use synonyms
Firstly
, men there were chosen science more than other subjects and the percentage was 23 per cent. Followed by mathematics was 18 per cent. Linking Words
Languages
were lowest was only two %
Use synonyms
Secondly
, women which interested in mathematics are very lowest was four %. Followed by law and arts were five % and six % respectively. Linking Words
Moreover
, Linking Words
languages
were 25 per cent and it was the highest.
Use synonyms
To sum up
,Linking Words