
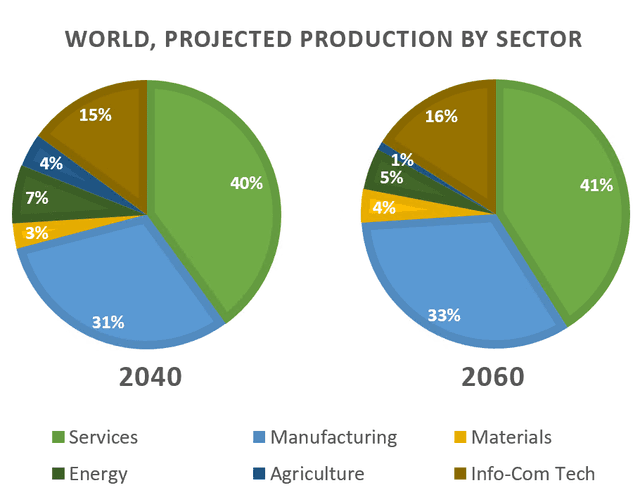
The two pie charts illustrate the world's projected manufacturing by section in 2040 and 2060.The figures are given in percentages.
Overall
, it can be seen from the information that the sector of production is categorized into 6 parts. Services and manufacturing are forecasted to be major sections of both years despite there Linking Words
is
two decades gap period.
In the year 2040, the services segment is predicted to be the biggest proportion of the world in terms of production at 40%, followed by manufacturing at 31%. Wrong verb form
being
Whereas
the minority of Linking Words
this
term is materials just 3%.
The projection for the year 2060, will remain forecasted in the same trend in which the two majority sectors services and manufacturing will be occupied at 41% and 33% respectively. Meanwhile, almost all sectors gradually increase in 20 years but the production of energy and agriculture will reduce both at 5% and 1% respectively which energy being the fewest part at 1%Linking Words