
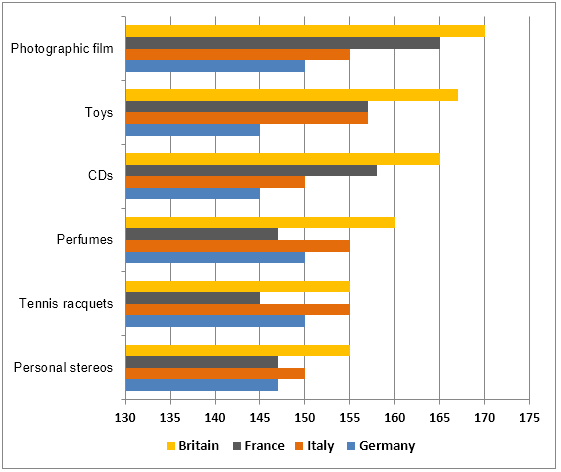
The bar graph provides data about the expenditure of people in
Britain
, France, Italy, and Germany on six types of items.
Use synonyms
Overall
, it can be seen that the greatest expenditure took place in Linking Words
Britain
, Use synonyms
whereas
buyers from Germany spent the least. Linking Words
Additionally
, Italy and France had almost the same expenses.
Starting with people in Linking Words
Britain
, they spent 170 only on photographic film, just followed by toys and CDs'expenses. It is worth noting that the money spent on tennis racquets and personal stereos was the same, they precisely spent 150 each. In stark contrast, German people's biggest amount of money consumed on consumer goods was 150, spending that same rate on photographic film, perfumes, and tennis racquets. Use synonyms
Furthermore
, Linking Words
while
the British crowd's smallest expense was 155, the German community's was 10 less than Linking Words
Britain
's.
Use synonyms
Moreover
, Linking Words
although
the gap between the French population and Italian's total outgoing was insignificant, the money each spent in the various categories was different, except for the sum spent in the toys category. Linking Words
While
their most substantial gap was 10 regarding the photographic film category, where they respectively spent 165 and 155, the slightest one was on personal stereos.Linking Words