
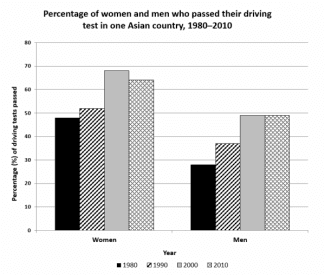
the bar chart shows the proportion of female and male
drivers
passing their driving test in one country in Asia over 30 years starting from 1980.
Use synonyms
overall
, it is evident that the year 2020 was the leading year with the highest rate, Linking Words
while
1980 experienced the opposite trend. Linking Words
Additionally
, more female Linking Words
drivers
were passing their driving test than those male Use synonyms
drivers
and the percentage of passed Use synonyms
drivers
witnessed a dramatic increase in Use synonyms
this
period.
on the one hand, there was a massive rise in the proportion of female Linking Words
drivers
in the first 20 years of Use synonyms
this
period. It rose almost 30% from 1980 to 2000 and Linking Words
then
see a slight decrease in 2010 around 2%.
Linking Words
on the other hand
, turning to the other gender, it is clear from the graph that the proportion of male Linking Words
drivers
passing their driving test experienced a sharp growth ranging from approximately 28% to 49% in 1980,2010 respectively.Use synonyms