
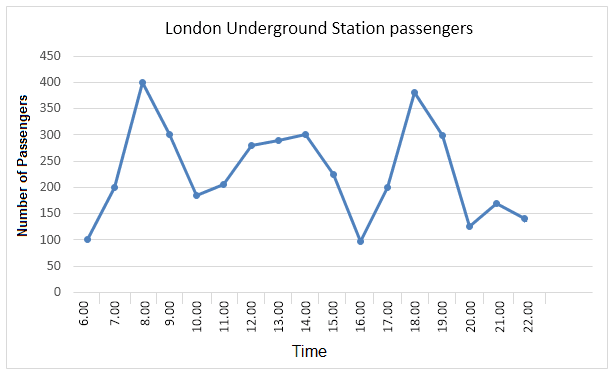
The given graph illustrates the
number
of passengers who used the underground station in London. Use synonyms
This
data was collected based on one-hour intervals from 6 am to 10 Linking Words
pm
.
Taking a closer look at the chart, one can see Underground Station users at 6 o'Use synonyms
clock
had the smallest Use synonyms
number
of 100, the same as those at 16 o'Use synonyms
clock
. Use synonyms
Then
, the Linking Words
number
of passengers surged to 400 at 8 am, reaching the highest point, and plummeted to 190 at 10 am. A similar trend was seen between 4 Use synonyms
pm
and 8 Use synonyms
pm
. To be specific, it increased drastically from 100 at 4 Use synonyms
pm
to 390 at 6 Use synonyms
pm
, decreasing dramatically to 130 at 20 o'Use synonyms
clock
.
Use synonyms
In contrast
, passenger numbers from 12 o'Linking Words
clock
to 14 o'Use synonyms
clock
maintained stable, ranging from 280 to 300, but fell rapidly to 100 at 4 Use synonyms
pm
. Use synonyms
In addition
, Linking Words
the
relatively similar Correct article usage
a
number
of people used the underground station at 10 and 11 am, 190 and 205, respectively.
Use synonyms
Overall
, it is true that the figures fluctuated over the given period. Linking Words
Moreover
, people visited the underground during their commuting time the most.Linking Words