
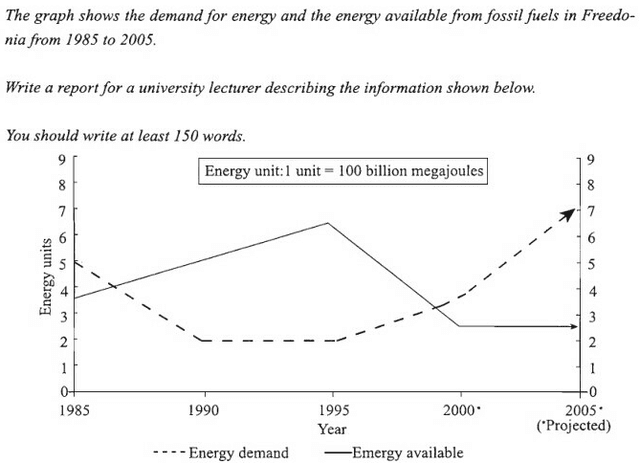
The graph gives information about the demand for
energy
and the Use synonyms
energy
available for fossil fuels in Freedonia between 1985 and 2005.
Use synonyms
Overall
, since both of them have fluctuated, the order between them is changing two times.
In 1985, in terms of the need for Linking Words
energy
, the amount of it was about 5.0, Use synonyms
whereas
that of the Linking Words
energy
supply was under 4.0. In Use synonyms
this
regard, the gap between them is almost 1 and a half.
contrary to 1985, in the middle of from 1985 to 1990, the amount of the supply overtook that of the requirement. In 1995, the amount of supply peaked at approximately over 6.0, whilst that of the Linking Words
energy
need was the lowest in 1995 about 2.0 and it caused the highest gap between them.
Between 1995 and 2005, they had different trends compared to the previous graph. The figure for Use synonyms
the
availability shrank, Correct article usage
apply
while
that of the demand skyrocketed. Linking Words
Consequently
, the figure for the demand overtook that of the availability again.Linking Words