
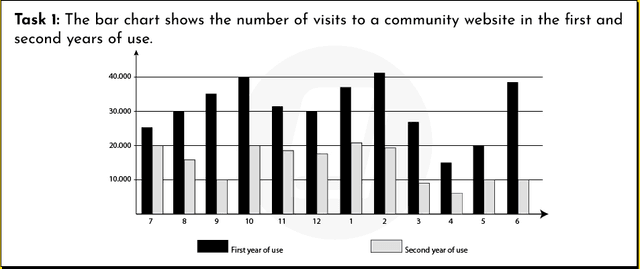
The graph indicates the volume of visits to a website of
community
in the Correct article usage
a community
first
Use synonyms
year
and Use synonyms
second
Use synonyms
year
of Use synonyms
use
, respectively.
Use synonyms
Overall
, the number of visits in the Linking Words
second
Use synonyms
year
displayed an increase compared to the Use synonyms
first
Use synonyms
year
, in which the majority of browsing was conducted in the later Use synonyms
year
.
In the Use synonyms
first
Use synonyms
year
of Use synonyms
use
, the website barely had visitors in February, Use synonyms
however
, the figure surged to 12500 between February and July, Linking Words
while
in the Linking Words
second
Use synonyms
year
of Use synonyms
use
, the number went up from 10000 to surpassing 20000 in the same period of time. On top of that, the most dramatic difference between the Use synonyms
first
and the Use synonyms
second
Use synonyms
year
of Use synonyms
use
showed in February, the latter was 1000 times larger than the former.
Use synonyms
On the other hand
, the same trend was displayed between September and November, fostering the visits in the Linking Words
first
Use synonyms
year
of Use synonyms
use
surged to 10000 in November, compared to the Use synonyms
second
Use synonyms
year
of Use synonyms
use
, exceeding 15000. In the following month, both figures remained unchanged.Use synonyms