
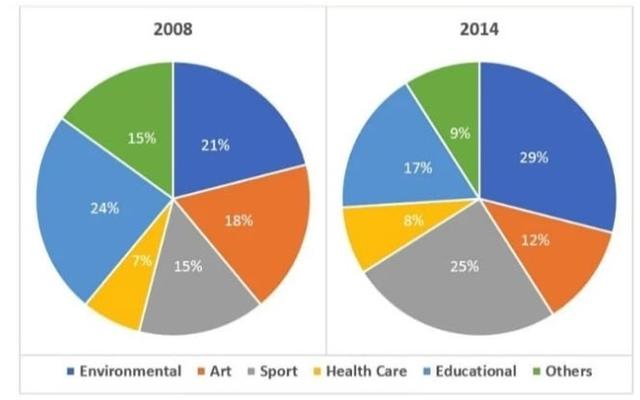
The two pie charts illustrate the figure of individuals who participated in several aspects without earning any income in 2008 and 2014.
Overall
, it can be seen that the majority of volunteers worked for the educational part in 2008 and the environmental sector in 2014, Linking Words
whereas
the number of individuals required for the healthcare part accounted for the least compared with others in both years.
It is undeniable that, in 2008, a large number of inhabitants engaged in charitable activity in the academy sector, which constituted 24% of the total. In terms of sports and others, they shared the same pattern of volunteers, which equally accounted for 15%. Linking Words
While
the proportion of individuals who worked in the environment was 21%, those in the healthcare part had the lowest proportion, at only 7%.
Regarding 2014, Linking Words
while
a significant proportion of people joined in charitable activity in the environmental, sports, and educational sectors, there were 29%, 25%, and 17%, respectively; only 8% and 9% of inhabitants worked in healthcare and other sectors.Linking Words