The bar chart below shows the percentage of people who ate five portions of fruit and vegetables per day in Uk from 2001 to 2008

The bar chart below shows the percentage of people who ate five portions of fruit and vegetables per day in Uk from 2001 to 2008
IELTS Writing Task Chart for The bar chart below shows the percentage of people who ate five portions of fruit and vegetables per day in Uk from 2001 to 2008
✨ Do you want to improve your IELTS writing?
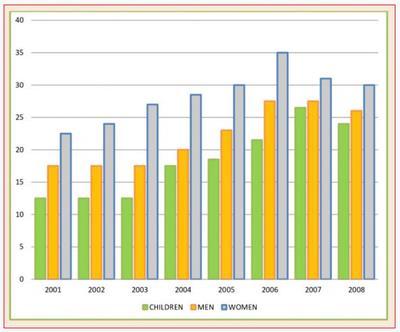
The figure illustrates the proportion of
men
Use synonyms
,women and
children
Use synonyms
who consumed greens per day in the UK in the 8-year period between 2001 to 2008. It is interesting to notice that in the 8-year period of time, the people who were in the category of
men
Use synonyms
and
children
Use synonyms
were nowhere near the women,which was the highest
percentage
Use synonyms
of consuming fruits and vegetables. Meanwhile, the proportion of
children
Use synonyms
was the lowest in consuming greens. The
percentage
Use synonyms
of women who ate fruits and vegetables started at the point of almost 20% in 2001.Despite growing steadily to reaching a peak of over 40% in 2006,the
percentage
Use synonyms
then
Linking Words
went down slowly.Regarding the proportion of
men
Use synonyms
and
children
Use synonyms
, the figures started it point at 12% for
children
Use synonyms
and 18% for
men
Use synonyms
in 2001,after having a similar trend of steady growth,it climbed gradually to almost 30% for
men
Use synonyms
and 27% for
children
Use synonyms
in 2007,the
percentage
Use synonyms
then
Linking Words
had the small dip in 2008.
To conclude
Linking Words
it can be seen that all the figures were increasing until 2007,despite that there was a small dip in every figure in 2008.

Unauthorized use and/or duplication of this material without express and written permission from this site's author and/or owner is strictly prohibited. Excerpts and links may be used, provided that full and clear credit is given to Writing9 with appropriate and specific direction to the original content.

Introduction: The introduction is missing.
Introduction: The chart intro is missing.
Vocabulary: Replace the words men, children, percentage with synonyms.
Vocabulary: The word "figure" was used 4 times.
Vocabulary: The word "percentage" was used 4 times.
Vocabulary: The word "proportion" was used 3 times.
Vocabulary: The word "dip" was used 2 times.
Vocabulary: The word "almost" was used 2 times.
Topic Vocabulary:
  • Trend analysis
  • Significant fluctuation
  • Dietary habits
  • Public health campaign
  • Demographic breakdown
  • Socio-economic status
  • Predictive suggestions
  • Consumption rates
  • Dietary guidelines
  • Technological advancements
What to do next:
Look at other essays: