
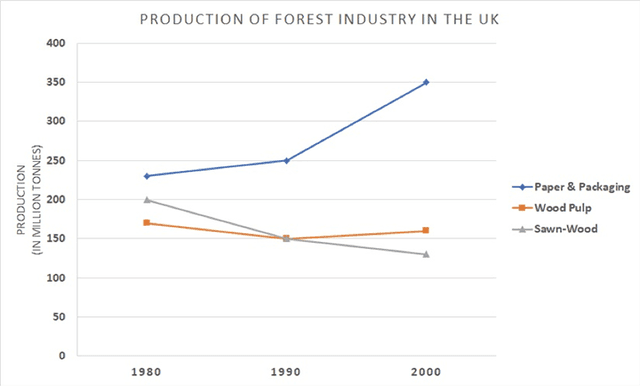
the line graph illustrates the
production
of forest materials, namely paper, Use synonyms
wood
Use synonyms
pulp
and sawn Use synonyms
wood
in the UK between 1980 and 2000.
Use synonyms
overall
, Linking Words
while
the Linking Words
production
of paper and packaging followed an upward trend throughout the surveyed period, the figures for sawn timber and Use synonyms
wood
Use synonyms
pulp
recorded an opposite trajectory.
Use synonyms
to begin
with, the manufacture of paper and packaging accounted for approximately 225 Linking Words
million
Use synonyms
tonnes
at the beginning of the given time, which Use synonyms
then
increased to 250 Linking Words
million
Use synonyms
tonnes
in the year 1990. in 2000, Use synonyms
this
figure hit its peak of 350 Linking Words
million
Use synonyms
tonnes
.
Use synonyms
in contrast
, the category of sawn-Linking Words
wood
and timber Use synonyms
pulp
Use synonyms
production
reached 200 and roughly 160 Use synonyms
million
Use synonyms
tonnes
, respectively in 1980. Use synonyms
however
, in the next 10 years, the Linking Words
production
of sawn timber decreased by 50 Use synonyms
million
Use synonyms
tonnes
, to 150 Use synonyms
million
Use synonyms
tonnes
. afterwards, the figure ended at 175 Use synonyms
million
Use synonyms
tonnes
. Use synonyms
furthermore
, the manufacture of Linking Words
wood
Use synonyms
pulp
followed a downward trend, taking up 150 Use synonyms
million
Use synonyms
tonnes
in 1990 before rising to the same yield as that in 1980 Use synonyms
at the end
of the period.Linking Words