
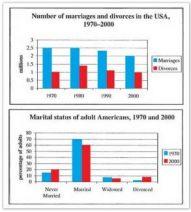
A glance at the bar charts provided reveals information about the number of marriages and divorces between 1970 and 2000,
as well as
the marital status of Linking Words
adults
in 1970 and 2000 in the United States.
As can be seen from the first graph, there was a slight decrease in marriage rates, Use synonyms
while
divorce rates fluctuated throughout the four years. Linking Words
On the other hand
, the second graph indicates that the majority of the Linking Words
adults
in the US were married in both years.
The number of marriages in 1970 was 2.5 Use synonyms
million
and remained unchanged until 1990Use synonyms
,
when it went down to approximately 2.3 Remove the comma
apply
million
. In 2000, it Use synonyms
also
fell by nearly 3 Linking Words
million
. As for the number of divorces, there was a huge increase of almost 500000 between 1970 and 1980. Use synonyms
However
, it plummeted to just above one Linking Words
million
in 1990 and remained almost steady in 2000.
There was a decrease in the percentage of both married and widowed Use synonyms
adults
in 1970 and 2000, Use synonyms
while
the percentage of people who never married or divorced increased in 2000. In 1970, 70% of the population were married, Linking Words
while
just below 10% of people were widowed, Linking Words
although
, in 2000, those percentages fell to about 60 and 5 respectively. Linking Words
Also
, in 2000, the percentage of unmarried Linking Words
adults
rose from nearly 15 to 20 and that of divorced Use synonyms
adults
Use synonyms
also
had a significant increase of about 6.Linking Words