
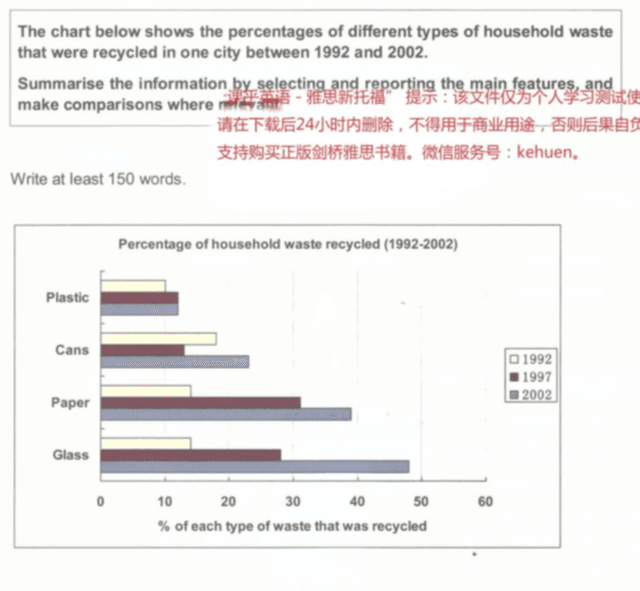
The given chart depicts the proportion of different types of household
waste
that were recycled in one city in two different years. There are four recycled Use synonyms
waste
, namely Use synonyms
plastic
, cans, Use synonyms
paper
, and Use synonyms
glass
.
Use synonyms
Overall
, in 2002, all percentages of Linking Words
waste
recycled rose. The highest Use synonyms
waste
that had been recycled was Use synonyms
glass
and the lowest was Use synonyms
plastic
. In 1997 and 2002 the Use synonyms
percentage
of Use synonyms
plastic
Use synonyms
waste
recycled experienced no changes.
In 1992 the Use synonyms
percentage
of Use synonyms
waste
recycled was unstable, for Use synonyms
paper
and Use synonyms
glass
was the same Use synonyms
number
. In 1997 and 2002 the proportion of Use synonyms
waste
recycled increased in all types of household Use synonyms
waste
. In 1992, the Use synonyms
percentage
of Use synonyms
plastic
was 10%, in 1997 the Use synonyms
number
slightly increased to 12% and in 2002 the Use synonyms
number
was stable. The cans disused in 1992 started at 19% and fell to 12% in 1997 and increased to 24% in 2002. Recycled Use synonyms
paper
in 1992 started at 13% and extremely increased in 1997 to 32% and rose again to 39% in 2002. Use synonyms
Moreover
, The Linking Words
number
of Use synonyms
glass
Use synonyms
waste
recycled in 1992 was 13%, rose to 28% in 1997, and increased to 48% in 2002. Use synonyms
In addition
, The Linking Words
percentage
of Use synonyms
paper
and Use synonyms
glass
in 1992 and 1997 was the same at 13%.Use synonyms