
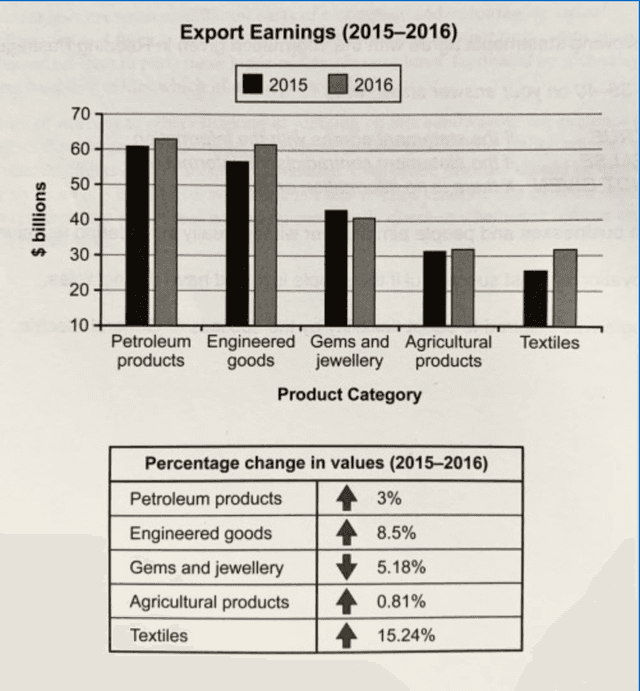
the given chart illustrates the number of different
goods
which are exported in 2015 and the next year and the table give us some information about changes in the percentage of Use synonyms
export
.
Use synonyms
according to
the Linking Words
chart
the value of petroleum Add a comma
,chart
products
and engineered Use synonyms
goods
in 2016 is more than the previous year. both kinds of stuff in 2016 are just over 60 Use synonyms
billion
Use synonyms
dollars
Use synonyms
while
in 2015 the Linking Words
export
of oil and gas Use synonyms
products
is a little more than 60 and engineered Use synonyms
goods
are approximately 57 Use synonyms
billion
Use synonyms
dollars
.,Use synonyms
moreover
the amount of agricultural Linking Words
products
and Use synonyms
textiles
exported shows a slight increase. for agricultural Use synonyms
products
it had changed by approximately 1 Use synonyms
billion
Use synonyms
dollars
and for Use synonyms
textiles
it shows a rise from 25 to 32 Use synonyms
billion
Use synonyms
dollars
. Use synonyms
in contrast
to previous Linking Words
products
in gems and ,jewellery we experienced a marginal decline. Its Use synonyms
export
of it reached 41 Use synonyms
billion
Use synonyms
dollars
in 2016,Use synonyms
whereas
it was 44 Linking Words
billion
Use synonyms
dollars
Use synonyms
last
year.
in ,addition we can see the change in these Linking Words
products
based on per cent. all of them had grown except gems and jewellery which had a drop of 5.18 %. maximum of growth belongs to textile 15.24%, after that engineered Use synonyms
goods
and petroleum Use synonyms
products
shows an increase of 8.5 % and 3%. the minimum rise related to agricultural Use synonyms
products
, .81%.
Use synonyms
overall
petroleum Linking Words
products
and engineered Use synonyms
goods
are the maximum amounts of Use synonyms
export
in spite of Use synonyms
textiles
having a minimum and Use synonyms
also
Linking Words
textiles
having the maximum growth of Use synonyms
export
Use synonyms
however
minimum amount belongs to agricultural Linking Words
products
.Use synonyms