
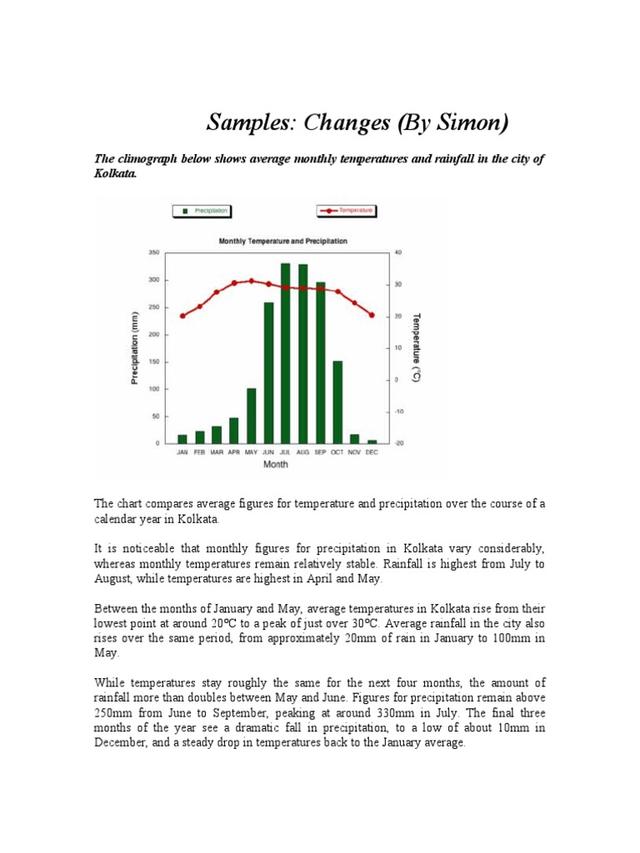
The charts present a comparison of mean data between temperature and rainfall in a particular city in India during a year.
In General, from the measurement
this
city experienced the highest precipitate from May to July had soared significantly, Linking Words
however
, the temperature measured gradually fell in the same period.
Looking into more detail, in the first quarter was recorded the rain occurred gradually increased from around 20 Linking Words
mm
to 40 Use synonyms
mm
, in ,addition the following quarter it was counted to be soaring roughly by 200 Use synonyms
mm
, and the peak in July was 325 Use synonyms
mm
and the next month fall into 300 in September, and sharply plummet In December 20 Use synonyms
mm
.
Use synonyms
On the other hand
, for temperature measured gap in a year is only 10 degrees Celcius from Linking Words
initial
to the end of the period. Correct article usage
the initial
Besides
, From January to Linking Words
May
it climbed from 20 to 30. After that, the city encountered the climate slightly decline from June to December at 20 Celcius.Add a comma
,May