
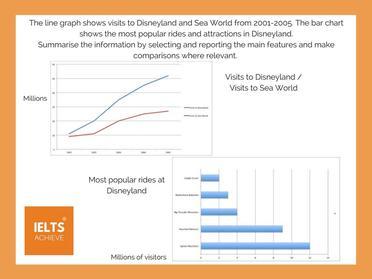
The given graph depicts the number of visitors to
Disneyland
and Use synonyms
Sea
World, Use synonyms
while
the given bar chart illustrates the rides and attractions in Linking Words
Disneyland
which were the most favourite in the period between 2001 and 2005
Use synonyms
Overall
, people, who visited Linking Words
Disneyland
and Use synonyms
Sea
Wolrd, had been increasing throughout the years. Use synonyms
However
, Linking Words
Disneyland
was higher visitors than Use synonyms
Sea
Worl, experiencing a peak in 2005 with more than 50 Use synonyms
million
people. Meanwhile, Use synonyms
Sea
World had its peak of under 30 Use synonyms
million
folks in 2005.
Looking at the bar chart in more detail, Use synonyms
it is clear that
the most famous rides and attractions visited were Splash Mountain, Haunted Mansion, Big Thunder Mountain, Matterhorn Boosledh, and Jungle Cruise. Linking Words
Moreover
, Splash Mountain was the most popular ride which was around 12 Linking Words
million
visitors in total, followed by Haunted Mansion with almost 10 Use synonyms
Million
tourists. Jungle Cruise was the least ride chosen by the guest.
Use synonyms
According to
the years, starting in 2001, Linking Words
Disneyland
rose significantly and consistently until 2005. Compared with Use synonyms
Sea
World which slightly enhanced in one year, and next rose dramatically, Use synonyms
then
remain stable from 2004 to 2005.Linking Words