
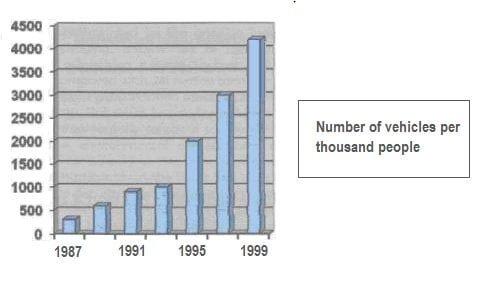
The graph lays out the number of Chinese owning transportation from 1987 to 1999.
This
writing will highlight some main features and make comparisons where relevant. The numbers will be represented in thousands (000).
In overview, there is a significant growth in vehicle ownership in the country and the numbers shown are indicating that there is immense buying from the people there within a decade.
Starting from the earliest year, the total purchases Linking Words
shows
that it was just less than 500 people who got to drive. Correct subject-verb agreement
show
Then
between 1987 to 1991, it gradually increased and doubled its initial starting year amount. It had Linking Words
then
jumped twice its original calculations.from below 400 to 2,000 within the range of 4 years. Linking Words
Furthermore
, it continued to double up by 1,000 units per year and Linking Words
finally
reached a peak atLinking Words