
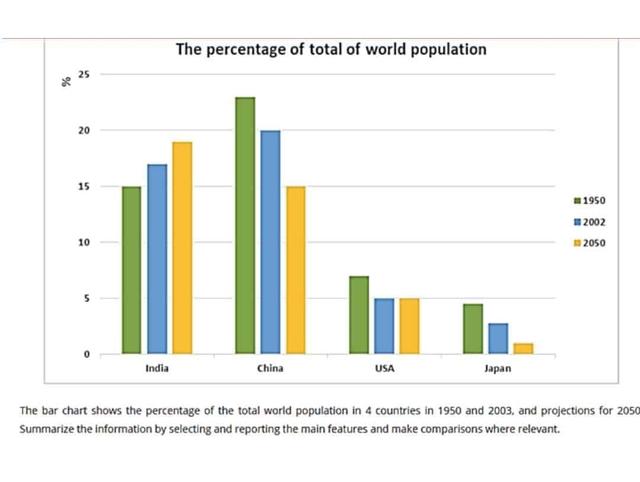
The bar chart compares the proportions of the culture between four countries in 1950 and 2002, and predictions for 2050.
Overall
, it can be seen from the graph that China has had the highest percentage of the Linking Words
population
over 50 years, Use synonyms
while
Linking Words
Japan
has reached the lowest percentage.
It is noticeable that opposition of the total world Use synonyms
population
change between India and China. In 1950, the number of inhabitants in China reached 23% which was the highest proportion. Until 2002, the amount of Chinese community fell by 3%. The decline continues as it is predicted that by 2050 it will be only 15%. Use synonyms
In contrast
, the graph shows that India has increased gradually communities from 1950 to 2050 with 15%, 17% and 19% in 2050.
From the statistics, it can be inferred that the Linking Words
population
changed in America and Use synonyms
Japan
. The USA had the estimate of total world inhabitants in 1950 at about 7% and went down slightly in 2002, at 5%. The projection for Use synonyms
a
number of American communities in 2050 will be the same rate as in 2002. The lowest proportion of the Correct article usage
the
population
is Use synonyms
Japan
which has had a significant reduction. In 1950, Use synonyms
Japan
reached 4% Use synonyms
then
fell in 2002, to 3%. Linking Words
Finally
, the rate of Japanese inhabitants will be 1% in 2050.Linking Words