
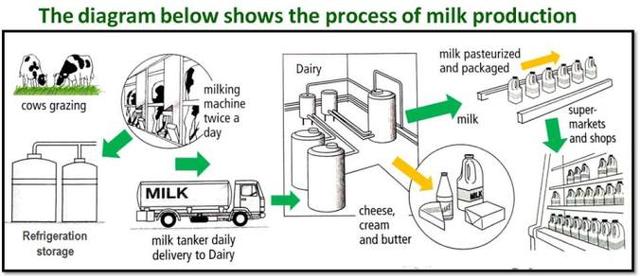
The diagram reveals how
milk
and similar products are being produced in various phases and Use synonyms
this
involves 8 phases from the cow in the farm till the Linking Words
milk
is extracted and packaged till it gets to the final consumer.
Use synonyms
Overall
, there are different laps of cream production both on the farm and factory. these stages are 8. The cream and buttermilk products are extracted from the cows after being well-fed on the farm, and the milking is done by extracting Linking Words
this
Linking Words
milk
through milking machines every day they are Use synonyms
subsequently
stored in the refrigerator at a normal temperature and Linking Words
thereafter
transferred to the dairy section through the half-and-half tanker whereby delivery is done daily.
Linking Words
Furthermore
, Milky in the diary section is Linking Words
however
converted into different products Linking Words
such
as cheese, cream, and butter after pasteurization and packaging in the factory and later sent to various supermarkets and shops for sale to the final consumers.
Linking Words
Finally
, the production of Linking Words
milk
andUse synonyms
and
other outcomes are achieved through the extraction of paste to pasteurization and packaging till the distribution to supermarkets and shops.Remove the redundancy
apply