
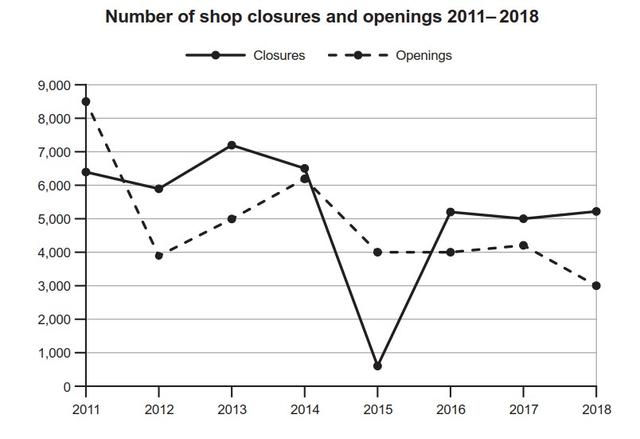
The graph illustrates, so many stores in a nation, that are shut down and newly opened in the period between 2011 and 2018.
Overall
, Linking Words
it is clear that
, at the beginning years to the end. There are ups and down demonstrating. Linking Words
However
, the main fall happened in the middle Linking Words
year
, Use synonyms
that is
2015. Linking Words
According to
the chart, most Linking Words
shops
opened in the early Use synonyms
year
.
Use synonyms
To begin
with, Linking Words
Firstly
, near to 9000 Linking Words
shops
were inaugurated in the Use synonyms
year
2011. Use synonyms
Whereas
, approximately 7000, retail Linking Words
shops
were closed in the same Use synonyms
year
. Use synonyms
Secondly
, In 2012, Closures were high in numbers, Linking Words
That is
around 6000 and opened Linking Words
shops
graph dramatically went down reaching 4000. Use synonyms
Thirdly
, above 7000 vendors were closed in the Linking Words
year
2013 and 5000 outlets were newly opened. Use synonyms
Furthermore
, we can see the same proportion of open and closed Linking Words
shops
, in the Use synonyms
year
2014. Use synonyms
That is
about 6000.
Linking Words
On the other hand
, There was a significant decrease in the Linking Words
year
2015. Less than 1000 Use synonyms
shops
were closed and 4000 Use synonyms
shops
were opened. In 2014 and 2015, opened and closed Use synonyms
shops
have almost the same in numbers which are 5000 closures and 4000 opened. Use synonyms
At the end
Linking Words
year
2018, the ratio of closed is higher than opened which are 3,000 opened and 5000 closed.Use synonyms