
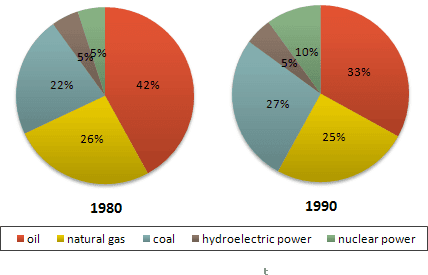
The pie chart demonstrates the key sources of energy utilized in the United States. In fact, the figures are given for the periods of the1980s and 1990s.
As a whole, oil can be recognized as the main source that was used to generate energy for both time periods.
On the contrary
, nuclear power was the least utilized medium as per the circle graph.
Most importantly, oil contributed to the majority of the production at 42% in the 1980s, Linking Words
whereas
, a 9% decrease was denoted in the succeeding decade. Linking Words
Moreover
, natural gas accounted for approximately half of the power requirements of America for both durations.
Coal was the most prominent source in the nineties after oil, at slightly higher than a quarter, whilst the preceding decade recorded an amount that was moderately higher than a fifth. In terms of hydroelectricity, the couple of decades exhibited the same numbers which were a minute minority of usage. Linking Words
Furthermore
, nuclear energy was employed to obtain power at 5% in the eighties, Linking Words
while
the amount doubled in the nineties.Linking Words