
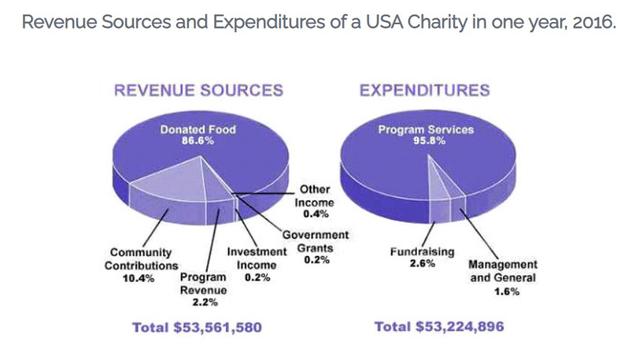
The pie charts show the proportion of revenue and expenditures in 2016 for a children’s charity in the USA.
According to
the data, it can be seen that donated food accounted for the majority of the income, Linking Words
while
program services accounted for the most expenditure. Total earnings sources just exceeded outgoings.
In detail, donated food provided most of the proceeds for the charity, at 86%. Linking Words
Similarly
, with regard to expenditures, one category, program services, accounted for nearly all of the outgoings, at 95.8%.
The other categories were much smaller. Community contributions, which were the second largest revenue source, brought in 10.4% of Linking Words
overall
income, and Linking Words
this
was followed by program revenue, at 2.2%. Investment income, government grants, and other salaries were marginal sources of proceeds, accounting for only 0.8% combined.
Linking Words
To sum up
, there were only two other expenditure items, fundraising and management and general. The total amount of earnings was $53,561,580, which was just enough to cover the expenditures of $53,224,896.Linking Words