The chart below shows the percentage of people who ate five portions of fruits and vegetables per day in the UK from 2001 to 2008. Summarize the information by selecting and reporting the main features and make comparisons where relevant. Write at least 150 words.

The chart below shows the percentage of people who ate five portions of fruits and vegetables per day in the UK from 2001 to 2008. Summarize the information by selecting and reporting the main features and make comparisons where relevant.

Write at least 150 words.
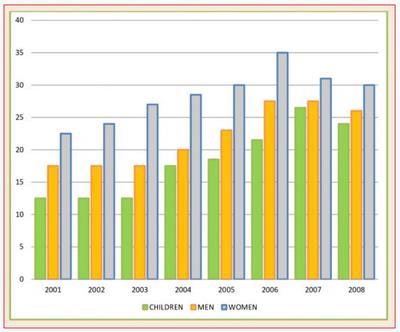
The given chart illustrates the proportion of the community who ate five portions of
vegetables
and
fruits
per day from 2001 to 2008 in the UK.
Overall
, women were the highest consumers of
fruits
and
vegetables
. The highest consumed was in 2006. The second rank was men, and the
last
place was children.
To begin
with, the percentage who ate greens in three different groups fluctuated. In 2001 the children consumed 13% of
fruits
and
vegetables
, the percentage remained stable in 2002 and 2003. The number rose to 2007 before falling in 2008 to 24%. In 2001-2003, men ate 17% of
fruits
and
vegetables
.
However
, in 2004-2005 it increased to 23%. The proportion continuously rose to 27% in 2007 and decreased in 2008. The women consumed greens at 24%, and the percentage slightly rose every year and reached the highest peak in 2006 at 35%.
Finally
, the proportion fell in two years to 30%.
Submitted by ieltscuns2022 on

Unauthorized use and/or duplication of this material without express and written permission from this site’s author and/or owner is strictly prohibited. Excerpts and links may be used, provided that full and clear credit is given to Writing9 with appropriate and specific direction to the original content.

Sentences: Add more complex sentences.
Conclusion: The conclusion is too long.
Vocabulary: Replace the words vegetables, fruits with synonyms.
Vocabulary: The word "percentage" was used 3 times.
Vocabulary: The word "proportion" was used 3 times.
Vocabulary: The word "fall" was used 2 times.
Vocabulary: Use several vocabularies to present the data in the second paragraph.
What to do next:
Look at other essays: