
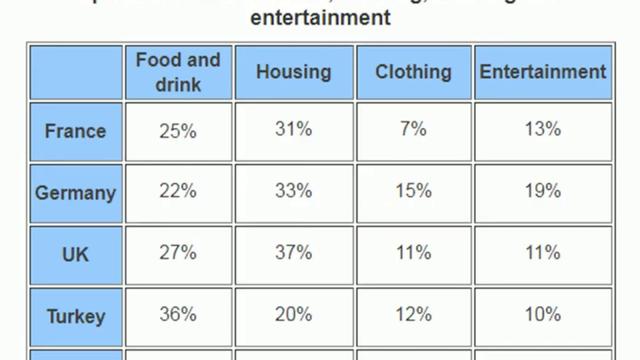
The presented table compares the percentages of monthly expenses in four categories in five countries in Europe , namely France, Germany, the UK, Turkey, and Spain.
Overall
, it can be seen that people in Europe spend most of their Linking Words
income
on food and refreshment and renting or buying houses Use synonyms
while
they spend the least of their money on buying new clothes or jackets.
In the United Kingdom, the fees for housing account for 37% of household Linking Words
income
, which is 4% and 6% higher than that of Germany and France respectively. Use synonyms
Also
, people in these three countries spend a quarter of their Linking Words
income
on food and drink, which is two times more than they spend on leisure activities. Use synonyms
However
, they spend no more than 15% of their Linking Words
income
on clothing, of which Germany spends 15%, France and the British spend 7% and 1% of their salary respectively.
As for the remaining two countries, the expense Use synonyms
for
food and drink is the highest, with 36% and 31% of Change preposition
of
income
spend on them in Turkey and Spain respectively. Use synonyms
Whereas
, they spend about 20% of their salary on housing expenses.Linking Words