
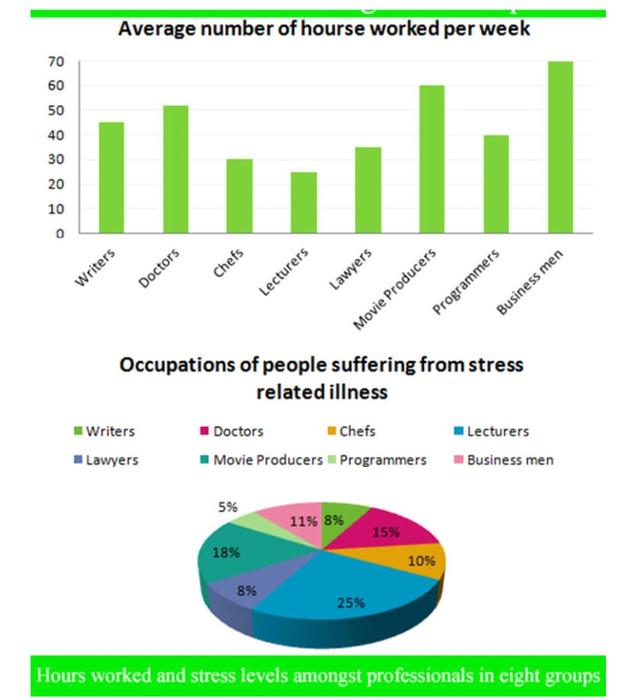
The bar graph illustrates the average amount of time spent per week on eight types of jobs,
while
the pie chart portrays the percentage of stress levels among professionals.
Linking Words
Overall
, Businessmen have the highest number of Linking Words
hours
worked, Use synonyms
whereas
the Linking Words
lecturers
spend the lowest ones. Speaking of the stress level, Use synonyms
however
, Linking Words
lecturers
are the most suffered of it followed by movie producers.
Looking into details, the average time spent working per week is mostly spent by businessmen with 70 Use synonyms
hours
, followed by movie producers and doctors with 60 and up to 50, respectively. Programmers and writers spend up to 40 Use synonyms
hours
but no more than 50. Use synonyms
Moreover
, Linking Words
lecturers
spend their time around 20 Use synonyms
hours
per week. They are at the bottom position compared to chefs and lawyers who have more than 30 Use synonyms
hours
.
Use synonyms
On the other hand
, Linking Words
lecturers
are the most suffering of stress in their job with 25%, even though their working Use synonyms
hours
are fewer than all the specialists. Movie producers are in the second position with 18%, followed by doctors, businessmen, and chefs up to 10%. Use synonyms
Furthermore
, lawyers and writers have the same proportion of 8%, and there is only a tiny rate (5%) of programmers that suffered from that issue.Linking Words