
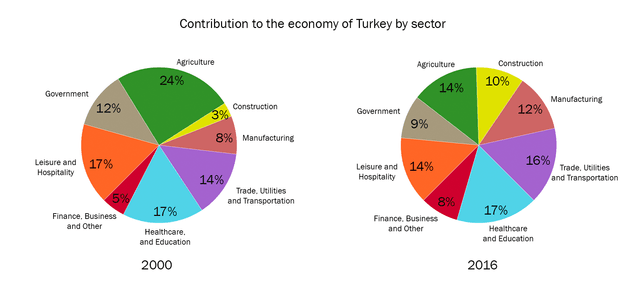
The given pie charts illustrate the proportions of some particulars field that involve in Turkey's economy between 2000 and 2016.
By and large, there were some changes that occurred in most of the sectors,
however
, one of them was stay.
Healthcare and Education together kept the 17% of contribution in both of the years. Meanwhile, Construction made it to Linking Words
rose
more than three (3-10). A similar trend was Wrong verb form
rise
also
shown by finance, business, and others that increased by almost twice per cent (5-8). Linking Words
In addition
, Manufacturing join the group which increased the contribution, it grew from 8% to 12%, Linking Words
together with
Trade, Utilities, and Transportation (counted as one sector) which went up from 14% to 16%.
Linking Words
Besides
, the Agriculture sector significantly decreased the contribution from 24% to 14%. There are Linking Words
also
Leisure and Hospitality that dropped from 17% to 14%. As mentioned in the beginning, most of the aspects are dropped in proportions, including Government which went down from 12% to 9%.Linking Words