
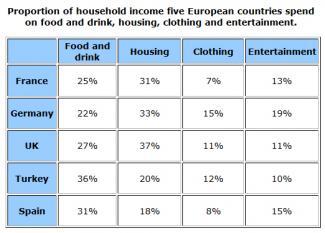
The table shows information about the spending of monthly household earnings in four countries
such
as France, Germany, the UK, Turkey and Spain.
It is apparent from the table, that food and drink have a big average Linking Words
percentage
rather than other necessities which is turkey in the first placement at 36%. Use synonyms
Similarly
, housing Linking Words
also
has enormous numbers and the UK has the highest Linking Words
percentage
with 37%.
The entertainment and clothing necessity is not too much as people spend their income consuming food and housing. Use synonyms
Although
, entertainment has a higher average number than clothing with Germany as the country which has the biggest Linking Words
percentage
at 19%. Clothing has the lowest Use synonyms
percentage
of proportion which is the biggest in Germany with 15%.
Use synonyms
Overall
, there are each different necessity proportions of spending income in four countries. The allocation for food and drink is the highest proportion, Linking Words
,
Change the punctuation
apply
Linking Words
however
people do not really spend their income on clothing necessities.Add a comma
,however