
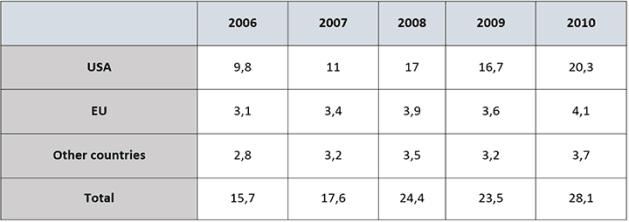
The table illustrates the financial funds that America, Europe, and other countries allocated to developing their land from 2006 to 2010.
Overall
, Linking Words
it is clear that
the amount of money donated saw an upward trend during the whole 5 years. Linking Words
While
the USA had the most development funds, the EU and other nations gave almost similar small amounts in Linking Words
this
period.
In 2006, the money that America spent on developing countries was $9,8 Linking Words
million
; Use synonyms
in contrast
, Linking Words
this
figure from the EU and other nations was just about $3,1 Linking Words
million
and $2,8 Use synonyms
million
, respectively. In the next 2 years, the country development budgets from all regions increased steadily before experiencing a slight drop of 0,3 Use synonyms
million
in 2009, and these funds rose again in 2010. The same tendency can be seen in the total donations of all countries, which grew from $15,7 Use synonyms
million
to $28,1 Use synonyms
million
, except for the decline of 0,9 Use synonyms
million
in 2009.
In 2010, the US still had the biggest development fund with $20,3 Use synonyms
million
which was 5 times higher than the EU and other regions, 4,1, and 3,7 Use synonyms
million
dollars in specific.Use synonyms